Menu

Enterprise Performance Management
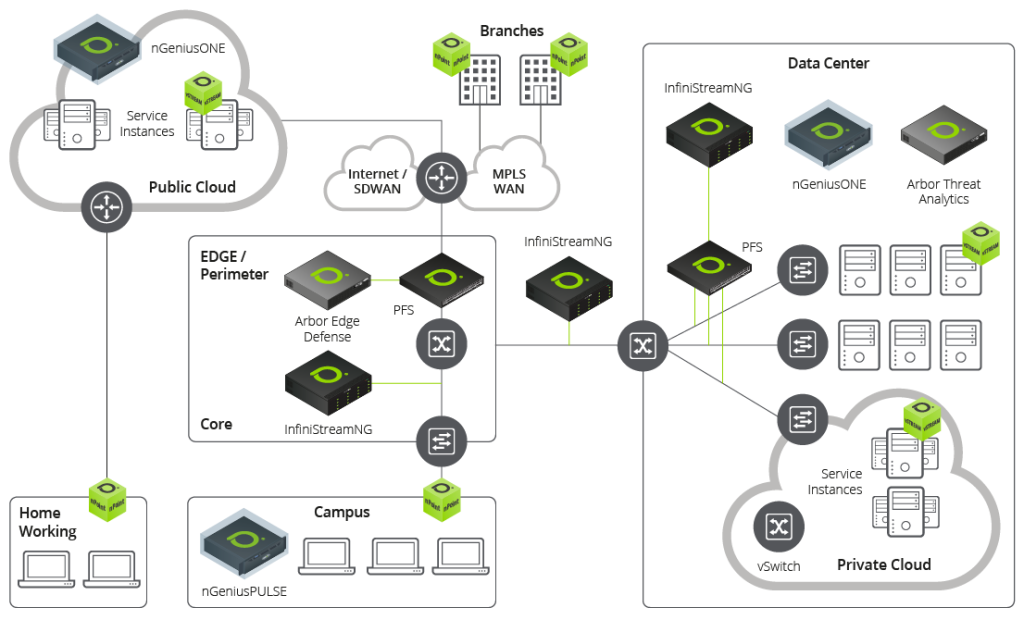
Delivering visibility across any data center, any cloud, any network, assuring robust digital service platform
Read MoreAdaptive Service Intelligence™ (ASI) technology
leverages the high-value wire traffic to generate “smart data” for smarter analytics to assure performance, manage risk, and facilitate superior decision making regarding application and network services
nGeniusONE Modules for Troubleshooting and Monitoring
Service Dashboard
Service Dashboard provides consolidated visual overviews of the health of application services, network services, and service domains in your network
Click to seeDiscover My Network
Discover My Network module provides an overall view of activity on your network, useful for ad hoc troubleshooting
Click to seeService Monitors
Service Monitors supports queries based on multiple applications / services supplied by data from appliances enabled for ASI classification
Click to seeService Enablers Monitor
Service Enablers category includes protocol-specific (DNS, DHCP, LDAP, and RADIUS) monitors of fundamental applications essential for all networks
Click to seeTraffic Monitor
Traffic Monitor can be used to analyze anomalous conditions affecting network performance such as unexpected/unidentified application traffic and link health based on specific indicators
Click to seePacket Analysis
Troubleshooting hard to solve problems by leveraging raw data to see the truth
Click to seeNotification Center
Notification Center provides a consolidated view of alerts and situations that have occurred during a specified time frame
Click to seeMy Report
My Reports module enables you to view reports created in the Report Configuration tool and Grid application
Click to seeGrid
Grid is a workspace where you can construct and view charts with monitored data and related context based on what is important to your enterprise
Click to see